
Energy Storage & Existing Generation
So, this has been around for a while in the GridMAP platform yet it is something that many people do not seem to ask for - although now the requests seem to be increasing.
The key question is this - the UK, and other countries, have installed significant amounts of solar & / or wind over the past decade and a lot of these assets are being used sub-optimally => in other words, they’re exporting to the Grid when they are better used on-site at their point of generation.
So, the question we should be asking is - does adding energy storage to these assets make economic and energy sense. And maybe a question prior to this should be => what is the optimal size of energy storage to get the most out of the system financially and energetically?
Luckily, GridMAP is here to help.
GridMAP is Argand’s energy storage optimisation software solution to enable clients to do just what we’re looking to do - find the optimal investment by analysing all of the energy & financial flows of all the possible permutations for a specified site.
GridMAP is the ultimate software solution for project developers within the energy sector
So, take a look at the demand profile below, which is the average import / export profile for a commercial client with existing solar PV installed. The question is, what is the best investment in energy storage to enable the client to best use the generation that is being exported to the Grid.

To start analysing this project, we built a project in the GridMAP platform to include the half-hourly import / export, the tariff structure, the export tariffs, energy storage cost curves and all of the other physical and financial constraints of the project.
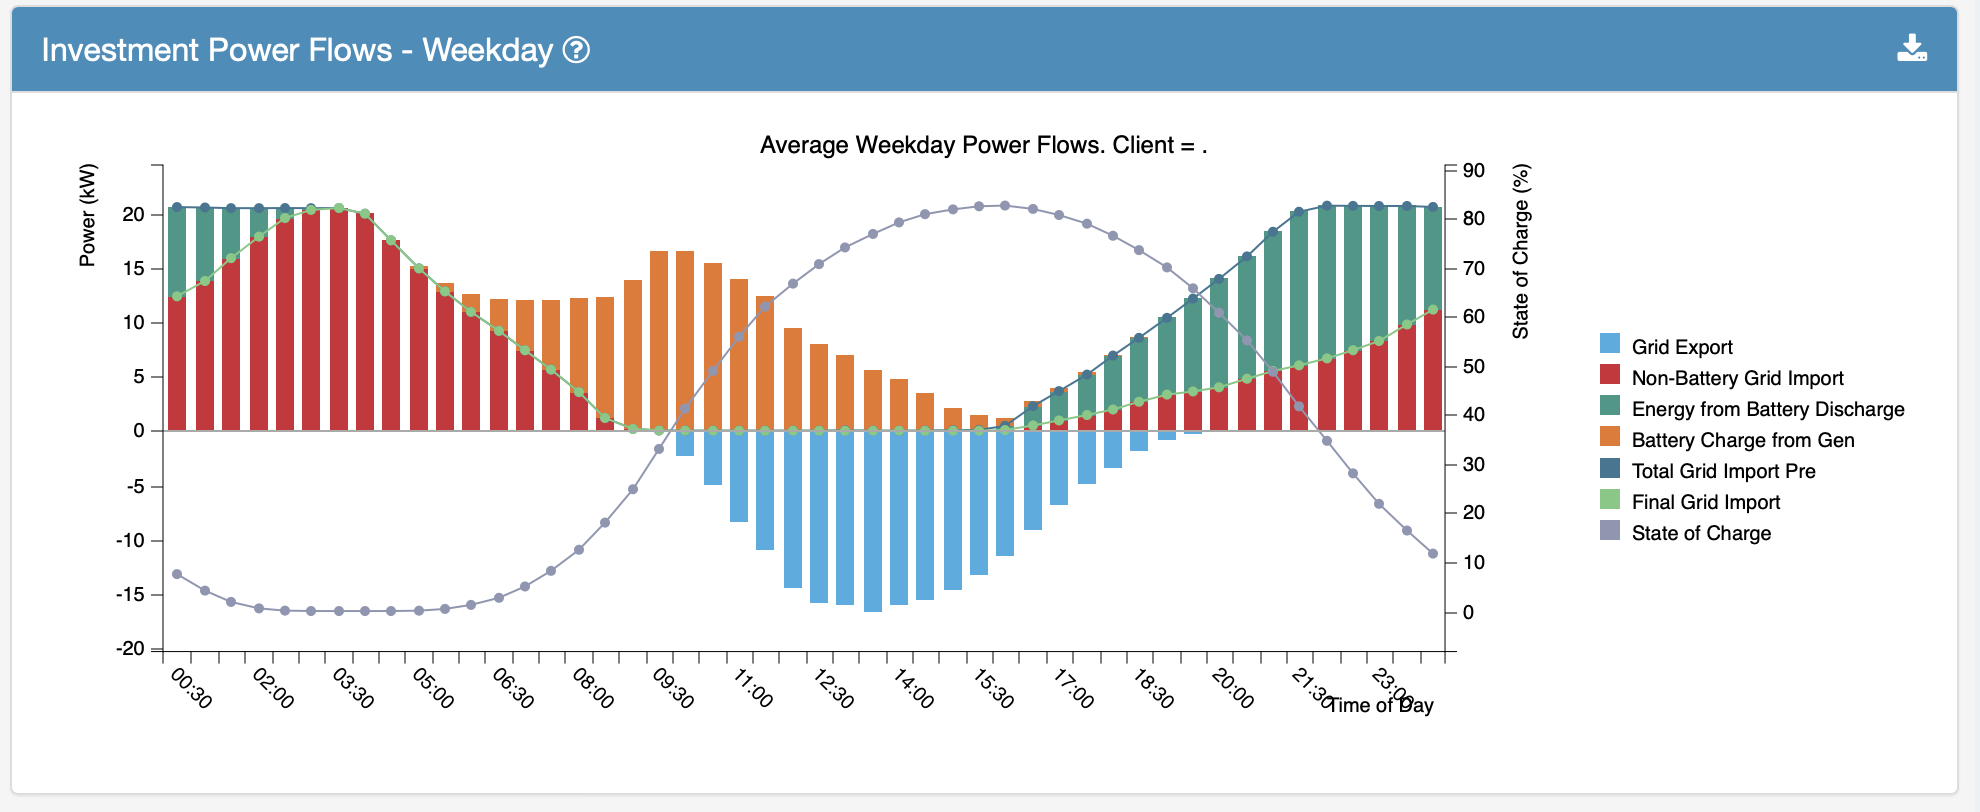
GridMAP took all of the inputs & constraints and then provide the client with a detailed assessment of 36 different permutations with different energy storage capacities, power values, strategies etc. An example result of the potential power flows for an average weekday is shown in the image below.
The orange bars show the predicted charge from export to the specific energy storage system (constrained by capacity, power & round trip efficiencies) with the average state of charge (SoC) increasing from 0% at about 6.30am in the morning to just over 80% (on average) by 5pm. The blue bars show the average export after the energy storage system (this particular size cannot take everything on board) and then discharges (shown by the dark green bars) to Grid Import in the evening and early morning. The client is left with the residual grid import shown in red.
So, what do we do with this?
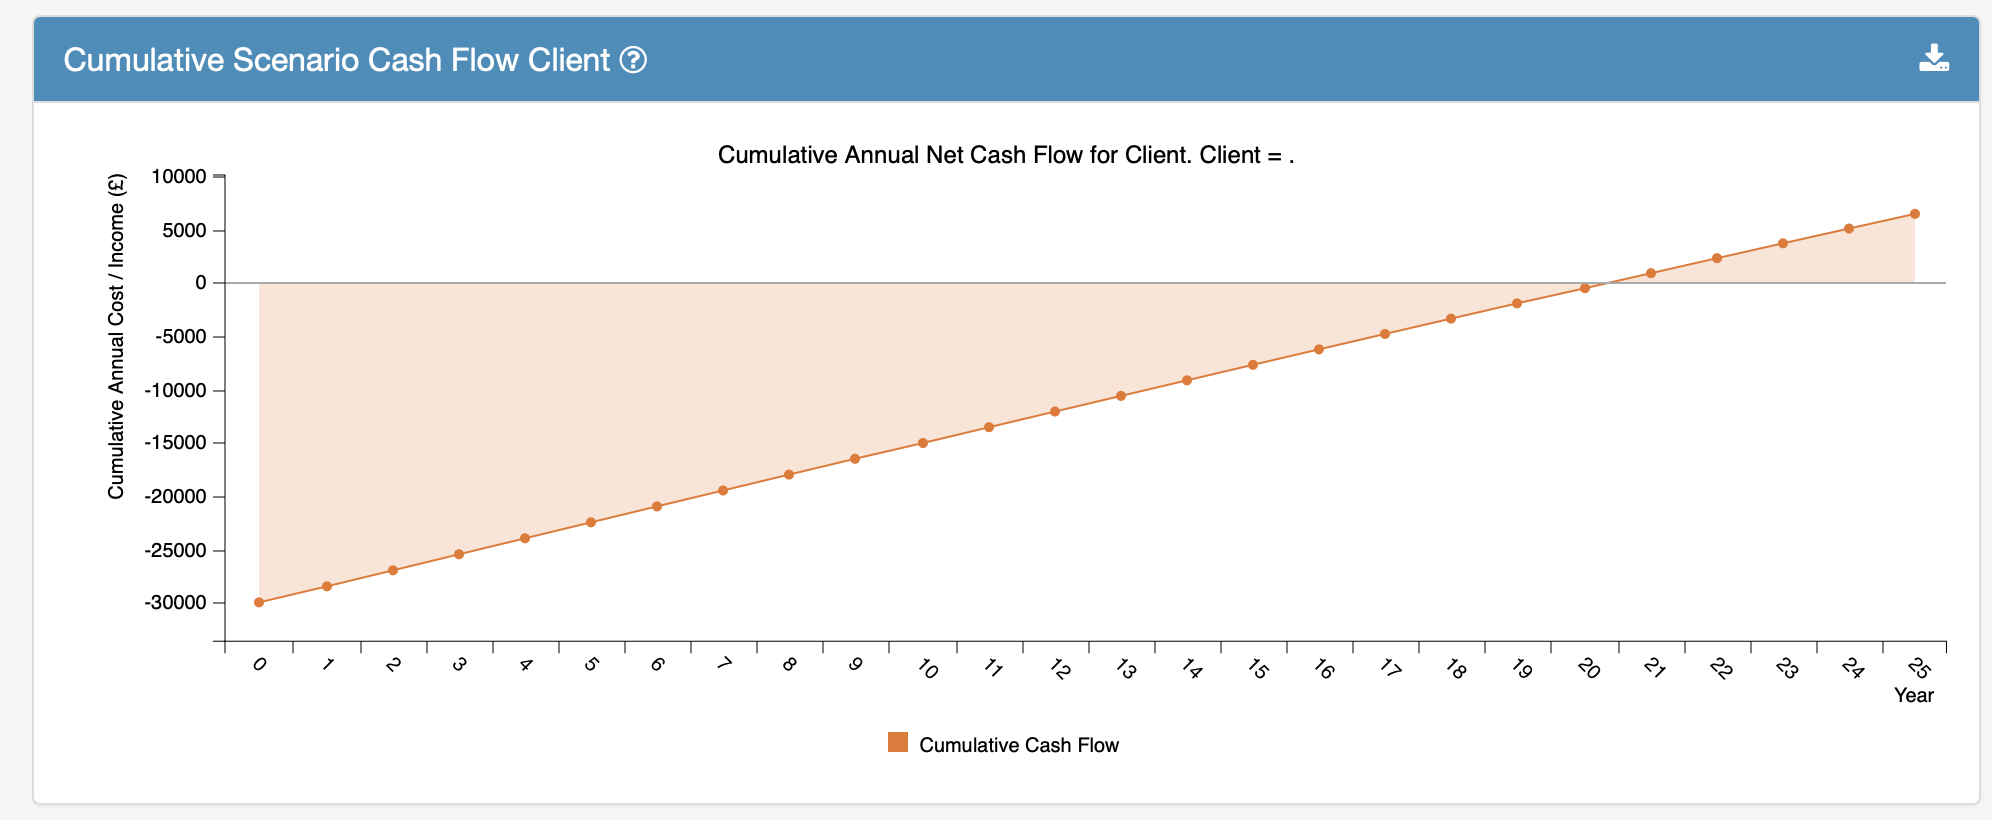
Well, all of the analysis is then put into our financial modelling element of GridMAP and analysed to determine the net present values (NPV) & / or internal rate of return (IRR). The image below shows one of the many financial charts that we produce to help understand the financial implications.
In this specific case, the chosen storage size has a fairly high payback which did not meet the client’s needs. However, in addition, we showed what the capital cost needed to be to enable the client to meet their investment hurdle.
If you’ve got a project you would like to analyse or you would like to sign up to use GridMAP, then please get in touch via gridmap@argandsolutions.com or +44-1803-864706 and we can have a chat about how to meet your needs.
Thanks!