

Modelling Energy Storage Returns with Flexibility
Analysing the returns from energy storage is hard enough before you account for the possibility of returns from engaging with flexibility markets. However, how do you approach this if you are being offered the option to provide flexibility?
In this article we detail the different elements required to understand prior to engaging in flexibility and how they relate to your possible returns.
How to Model the Different Income Streams of Energy Storage
If you are looking at investing in energy storage, one of the key challenges is working out how you will make the investment “wash its face”.
In brief, there are 2 keys ways to make money from an energy storage (battery) system:
1. Tariff savings
a. Charging from cheaper export or lower tariff periods and discharging into peak tariff price periods
2. Flexibility Income
a. Receiving money for ensuring your energy storage system can charge or discharge up to a proscribed power level when required at times of market stress
This is made harder because many suppliers of energy storage look to entice you with their offers of “flexibility” payments and tie-ins to specific energy supply contracts.
So, what should you do?
Well, the first thing to realise is that there are ways to analyse the different value streams from your energy storage system.
How to Understand the Requirement for Flexibility
Firstly we need to understand, and be clear about, the amount of headroom you will have to provide to engage in flexibility markets.
When you agree to providing the networks with flexibility you will have to agree to be “available” to participate for a specified power over a specified time.
Now, we know that power x time = energy, so we can then relate this commitment to the amount off storage capacity that you have.
In addition, it is worth making sure that we understand the term “C-rating.”
The C-rating is defined as follows:
C = nominal power rating of your storage system / energy storage capacity.
So, a 500kW battery system with 1000kWh of storage capacity will have a C = 0.5.
The other way of looking at C-ratings is to use the following equation:
C = 1 / (delivery time of power in hours)
In the example above, our system has a delivery time of 2 hours because it can deliver the full power capacity of 500kW for 2 hours before the energy capacity (from full) will move to zero.
Now, going back to our first point about the amount of time you are expected to deliver into a flexibility market, we can determine the following:
Flexibility Ratio (FR) = Agreed power x flexibility time required in hours
So, for example, if we have agreed to provide 500 kW of power for a maximum of 30 minutes, this gives us
FR = 500 x 0.5 = 250kWh
This can then be applied to the total energy capacity available which gives us:
Flexibility Availability (FA) = FR / Available capacity
So, in our example, this gives us an FA = 250 / 1000 = 0.25.
As such, in this example, to be able to access the flexibility markets as required (for 30 minutes), then we only need to ensure that our state of charge is between 25% and 75% because we need to be able to provide a charge of up to 25% full capacity or a discharge of up to 25% full capacity during the proscribed periods.
The Impact of Time
Now here is the interesting bit.
The shorter the period of time that we subscribe to a flexibility market, the lower the available capacity that needs to be available i.e. FA gets lower.
So, imagine you are providing 500 kW for a 1 minute market, then you will only need:
FA = 500 x (1/60) / 1000 = 0.00833 => 0.833%
What this means is that we can analyse the way our battery can help us at home or in our businesses by establishing 2 key areas of investment analysis:
1. Flexibility Returns
a. This is the annual payment per kW that we will receive from our aggregator by ensuring that our battery system is always between the FA limits to ensure there is always enough capacity for charge / discharge
2. Tariff / Market Returns
a. The remaining FA between the upper & lower bands can then be used for on-site tariff reduction and generation management.
We have seen too many clients try to model the returns by developing second by second frequency excel sheets and this just does not work (in our opinion) unless you are a market trader with all the available systems and knowledge.
So, what can you do?
GridMAP Can Help
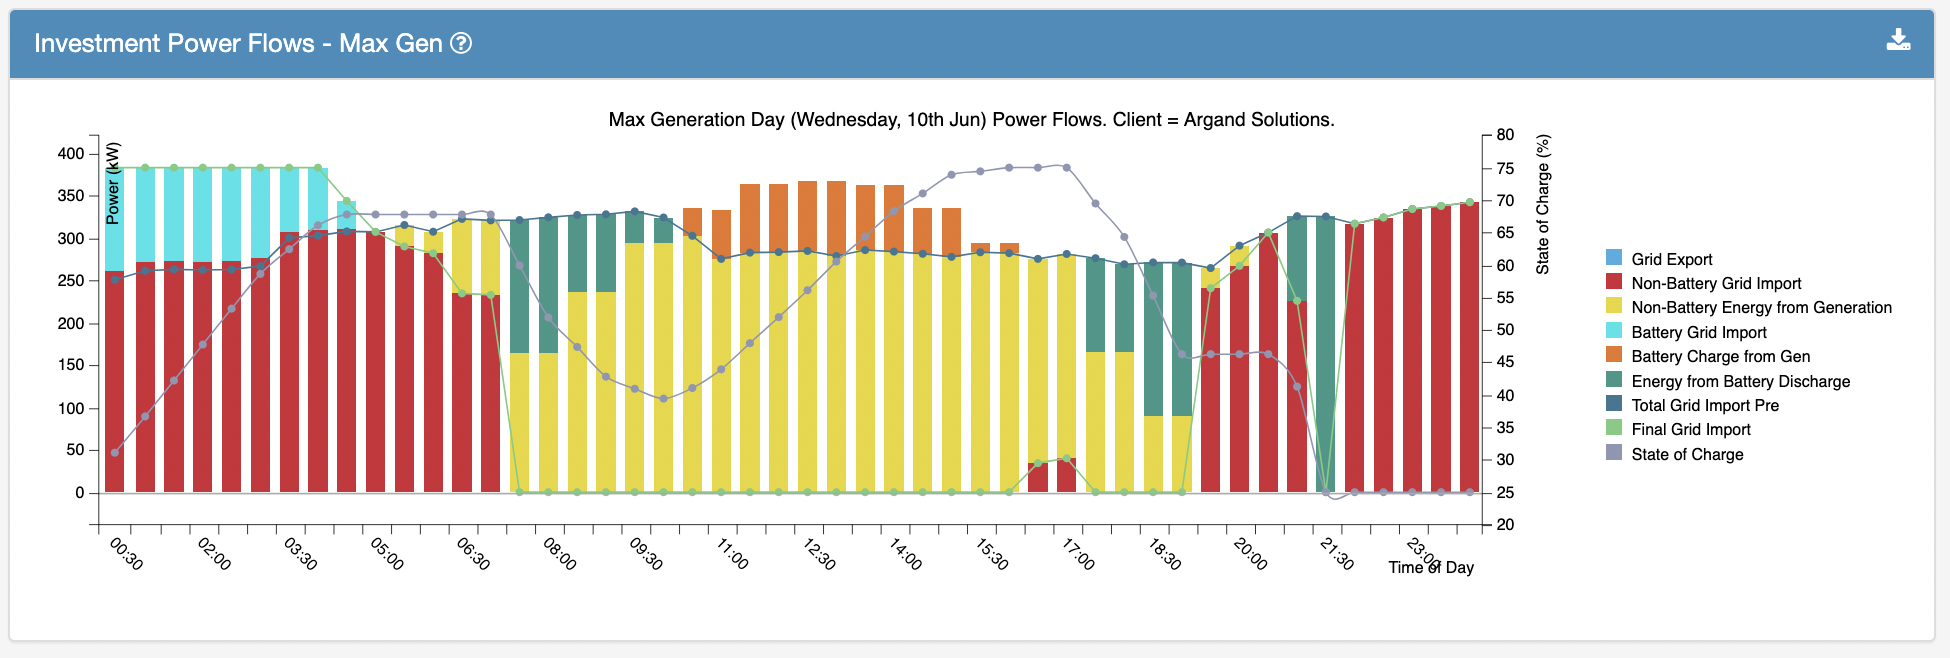
Our GridMAP platform has now developed the ability to model your project and establish the upper & lower boundaries that it must remain within to ensure you meet any flexibility requirements.
Thus, we are able to develop the investment analysis based upon tariff savings and export income combined with your flexibility payments for the unused / un-modelled capacity.
An example for a specific day is shown below where the client has an FA = 0.25 which implies a maximum state of charge (SoC) of 75% and minimum (SoC) of 25%.
The key point of this article is that to properly establish the potential for your energy system you need to be able to model the different income streams with clarity and precision.
And, more importantly, there is a way to do it.
For more information about this and how GridMAP can help, please call Argand Solutions on 01803 864706 or email bepositive@argandsolutions.com
Thanks!
Fraser Durham
Commercial Director